
Théo Sourget
Tuesday, July 9, 2024 | 9 minutes
[Citation needed] Data usage and citation practices in medical imaging conferences
Click on the image below to see my oral session at MIDL 2024:

Nowadays, the evaluation of models heavily relies on publicly available datasets used as benchmarking. While this could be a nice thing for a fair comparison of different models, we also question the effect of the diversity or more precisely a potential lack of diversity in research papers when selecting the datasets. A gap has been observed between the results showcased by AI models in research and their adoption in clinical workflow, we hypothesise that this gap could partly be a result of an overfitting of research on these datasets and we wanted to evaluate their usage to know if some are more popular than others. While this could seem like a straightforward task we’ll see that because of some elements it turned out to be not so simple.
In our paper [Citation needed] Data usage and citation practices in medical imaging conferences, we present a pipeline collecting the citations and mentions of datasets in research papers. We applied this pipeline to track 20 datasets in papers from MIDL and MICCAI between 2013 and 2023. Finally, we developed an annotation tool for PDF. Both the pipeline and the annotation tool are fully open-source to potentially extend our study to other fields of application.
Pipeline presentation
Overview
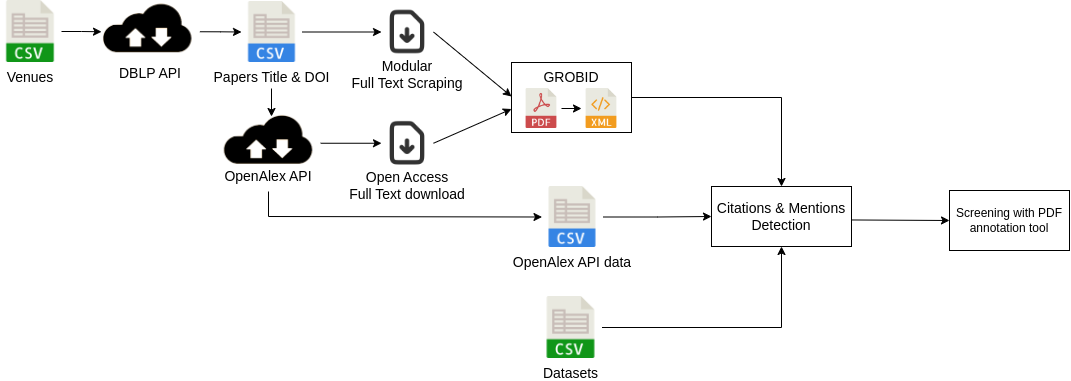
Let’s first present an overview of the pipeline before going into more detail about each part. The main idea of this pipeline is to have a tool that can be extended easily to other datasets or venues, we therefore rely on public APIs and open-access tools. After defining the venues and datasets to be analysed, we can divide this pipeline into 4 parts: 1) We obtain information on papers from the venues. 2) We collect and convert PDFs of the full texts into a format more easily parsable. 3) We detect the presence of the datasets mostly through regular expression matching with dataset names, aliases or URLs. 4) We verify the efficiency of our tool on a subset of papers thanks to our PDF annotation tools.
OpenAlex
I’ll now present the first source of data for our work OpenAlex. OpenAlex is an open citation index tool, it’s basically an API gathering information from multiple sources such as Crossref, the Microsoft Academic Graph or arXiv for example and it standardized the information from all these sources. We considered other alternatives for this part such as OpenCitation or SemanticScholar and we concluded that OpenAlex was the best solution as it provided more information or had a better coverage of papers. I have to mention that when searching for paper information the first tool that comes to mind is probably Google Scholar but no API is available to obtain data from it.
Here is part of the data from OpenAlex:
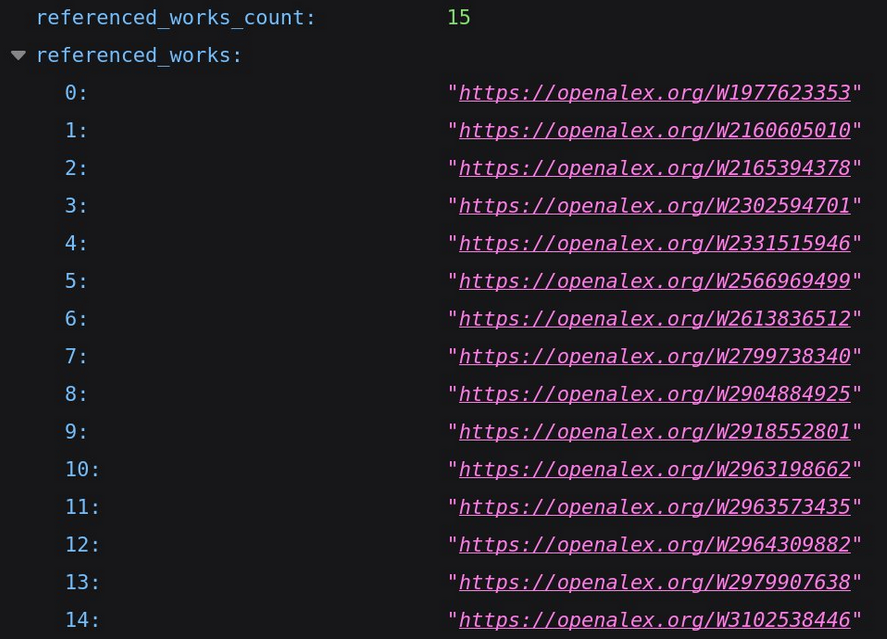
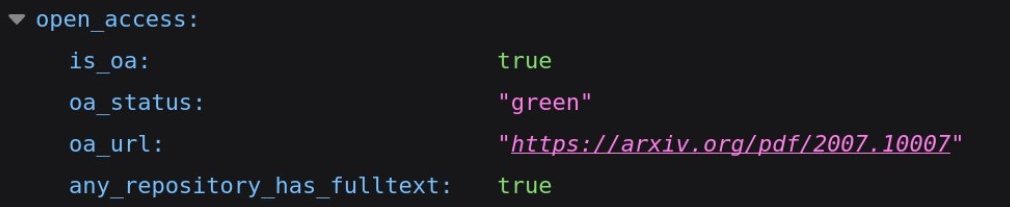
From the API, we were interested in the abstract of the paper, the references and when available the link to the full text PDF. As you can see, the list of references is already computed by OpenAlex and as each paper has a unique OpenAlex ID we just have to match the ID for the datasets to the one present for the paper. You can also see how the PDF can be accessed from OpenAlex, it is however not always possible.
Custom scraping tool
To deal with this issue we added the possibility of using an additional scraping tool to gather PDFs, in our case it was especially useful for the papers from MIDL that were poorly present in the API and for which the PMLR website allows a fairly easy scraping. To be more concrete we defined a scraping tool with scrapy to obtain all the PDFs from MIDL but in the end any external source of PDFs can be used it doesn’t need to be automated.
GROBID
Finally, the last part of our data collection and processing is to convert all the PDFs we obtained from the previous steps into a format easier to parse. To do it we decided to use GROBID, a library to convert raw documents like PDFs into XML and works especially well for scientific documents so it’s the perfect tool for our study. GROBID extracts the information from articles using a cascade of models to first divide the papers into main areas like title page, body, footnotes or reference section and then apply specific models for each area to re-structure the information in an XML format.
Here is an example of data obtained from the conversion:
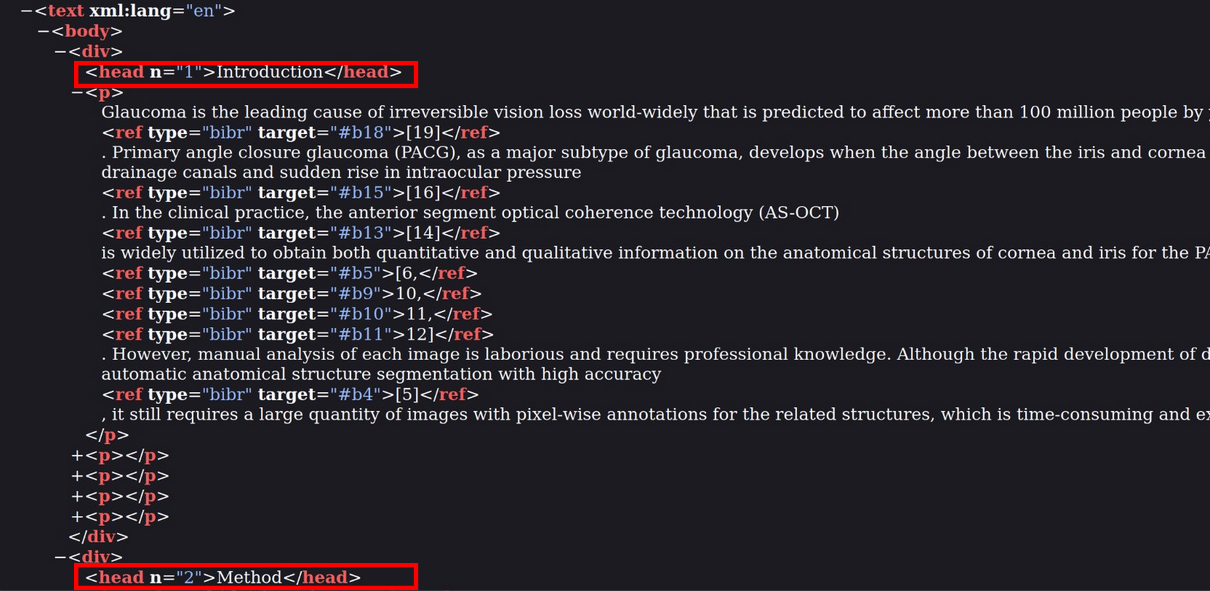
The XML preserve information on the sections as you can see in the red boxes with a division for the introduction and at the bottom the start of the division of the method section. The conservation of sections’ names is important as we believe only mentions from relevant parts of the full text like methods or data part indicate a usage, therefore we only extract mentions in these parts. Finally, GROBID can also handle the reference section and we used it to complement the matching done with OpenAlex to avoid relying on a single source for each information. Now that we have all the data, we can make the matching of regular expressions to detect the mentions of the datasets.
PDF annotation tool
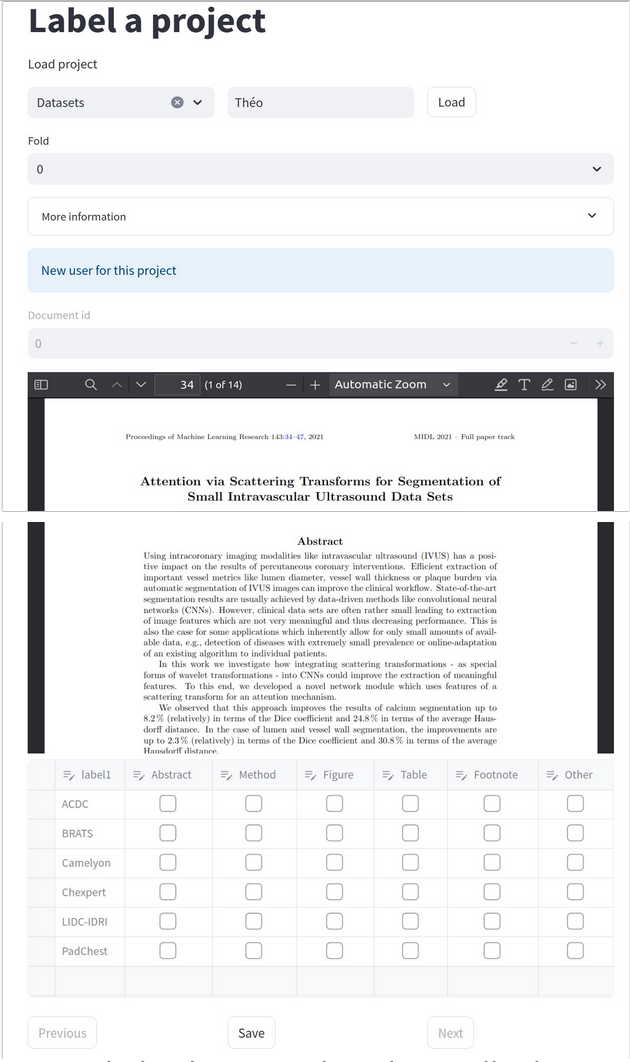
After the detection we evaluated the efficiency of our pipeline by screening some papers, we therefore had to annotate the PDFs but we couldn’t find the perfect tool for it as some alternatives like Taguette and LabelStudio had some major limitations for us like the conversion from PDFs to raw text for Taguette or the lack of free features for multiple annotators with Label Studio. We therefore developed our own annotation tools with Streamlit that allows multiple annotators for the same files and keeps the PDF format. You can also divide the papers into different groups to ease the division of annotations among the different annotators. As I said we applied this tool in our study to verify the location of different mentions in the paper but it can be applied to any PDF annotation task and it’s fully open-source and free so you can use it for your projects.
Results
Citations and mentions practices
Now that we have a complete view of our pipeline let’s talk about our findings. First I wanted to show why we needed such a process in the first place. I talked about dataset presence, but this presence takes very different forms. For example, only looking at the different citation practices, the most classical approach is like with the dataset name and the citations to the papers.
However, you can sometimes have citations without the name of datasets, this kind of citation is a problem for our study on the usage because this paper isn’t using the dataset while citing the paper.

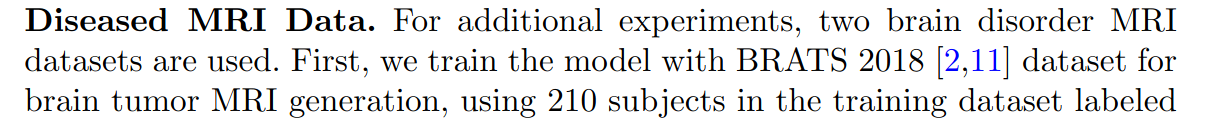
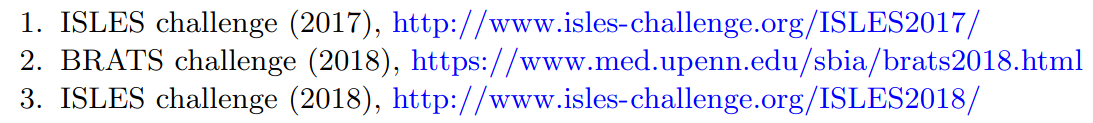
Finally, there are also bad citations, where the authors are not following the dataset guidelines like in the following image only putting the link to BRATS in the citations and not the papers as asked by the dataset guideline.
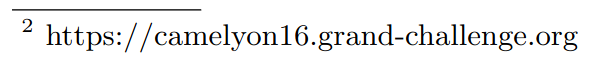
The same goes for the mentions, with various styles. We had the classical mention previously but there are also other possibilities like putting the dataset in the footnotes with the link or in specific structures like figures or tables.
We analyzed the different practices for the datasets we selected and could find 3 groups. We display the percentage of each group per venue and dataset in the next figure:
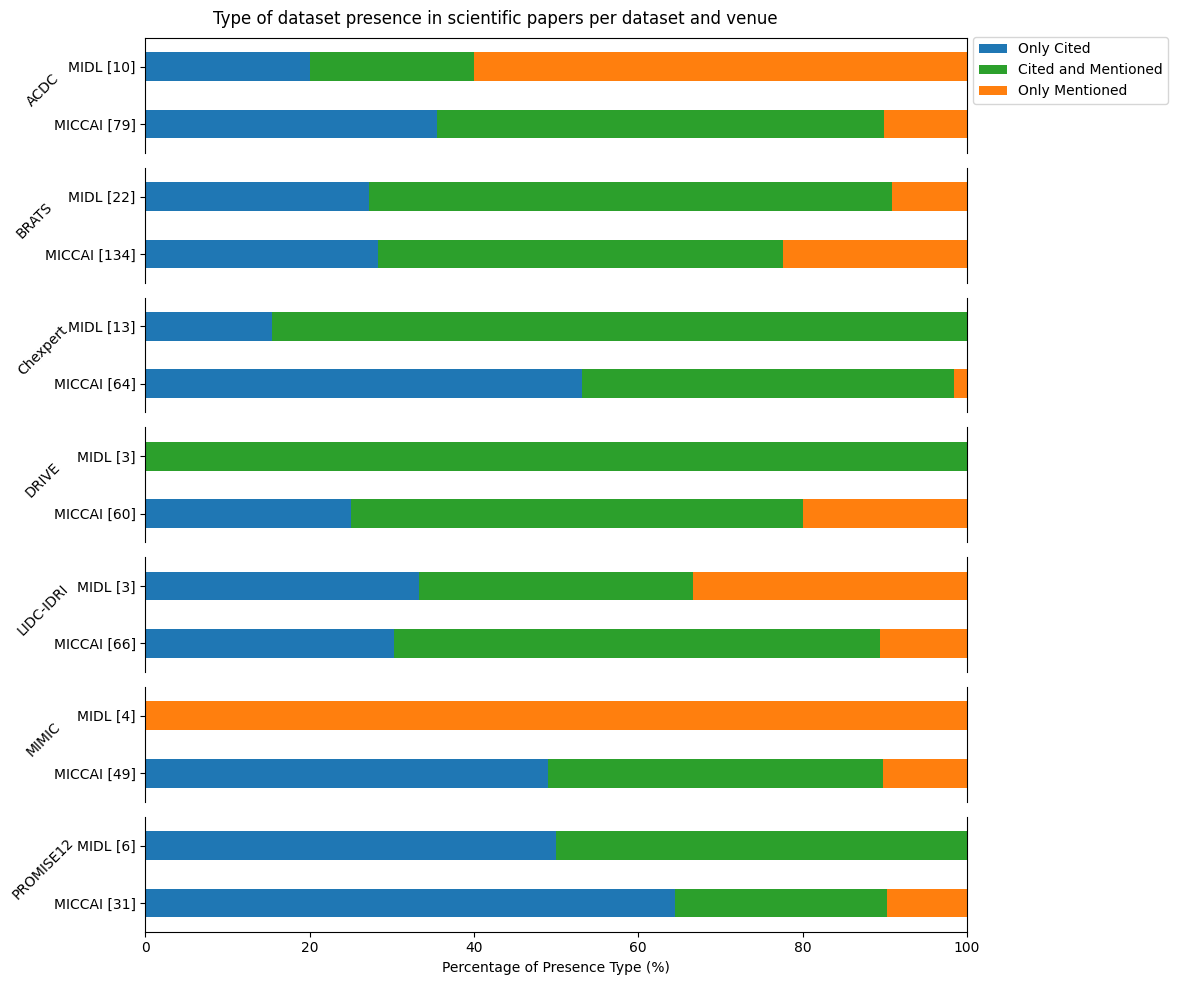
The first group is the “only cited”, as I said we hypothesise that when you only cite a dataset paper without mentioning its name, alias or URL in a meaningful part of the full text, there is no usage of the dataset itself but only its paper in the introduction or related works. Despite the variability, it often represents more than 25% of the paper for each dataset and venue. The second problematic group is the “only mentioned”, this group doesn’t cite the dataset paper but only mentions it or doesn’t follow the dataset guidelines as we discussed previously. It’s a problem because classical tools for citation tracking can’t detect these papers, it represents more than 10% of papers in most cases. Finally, there is the “cited and mentioned” group which is sort of the base case scenario. This highlights the lack of a standard way to acknowledge dataset usage in papers.
Popularity
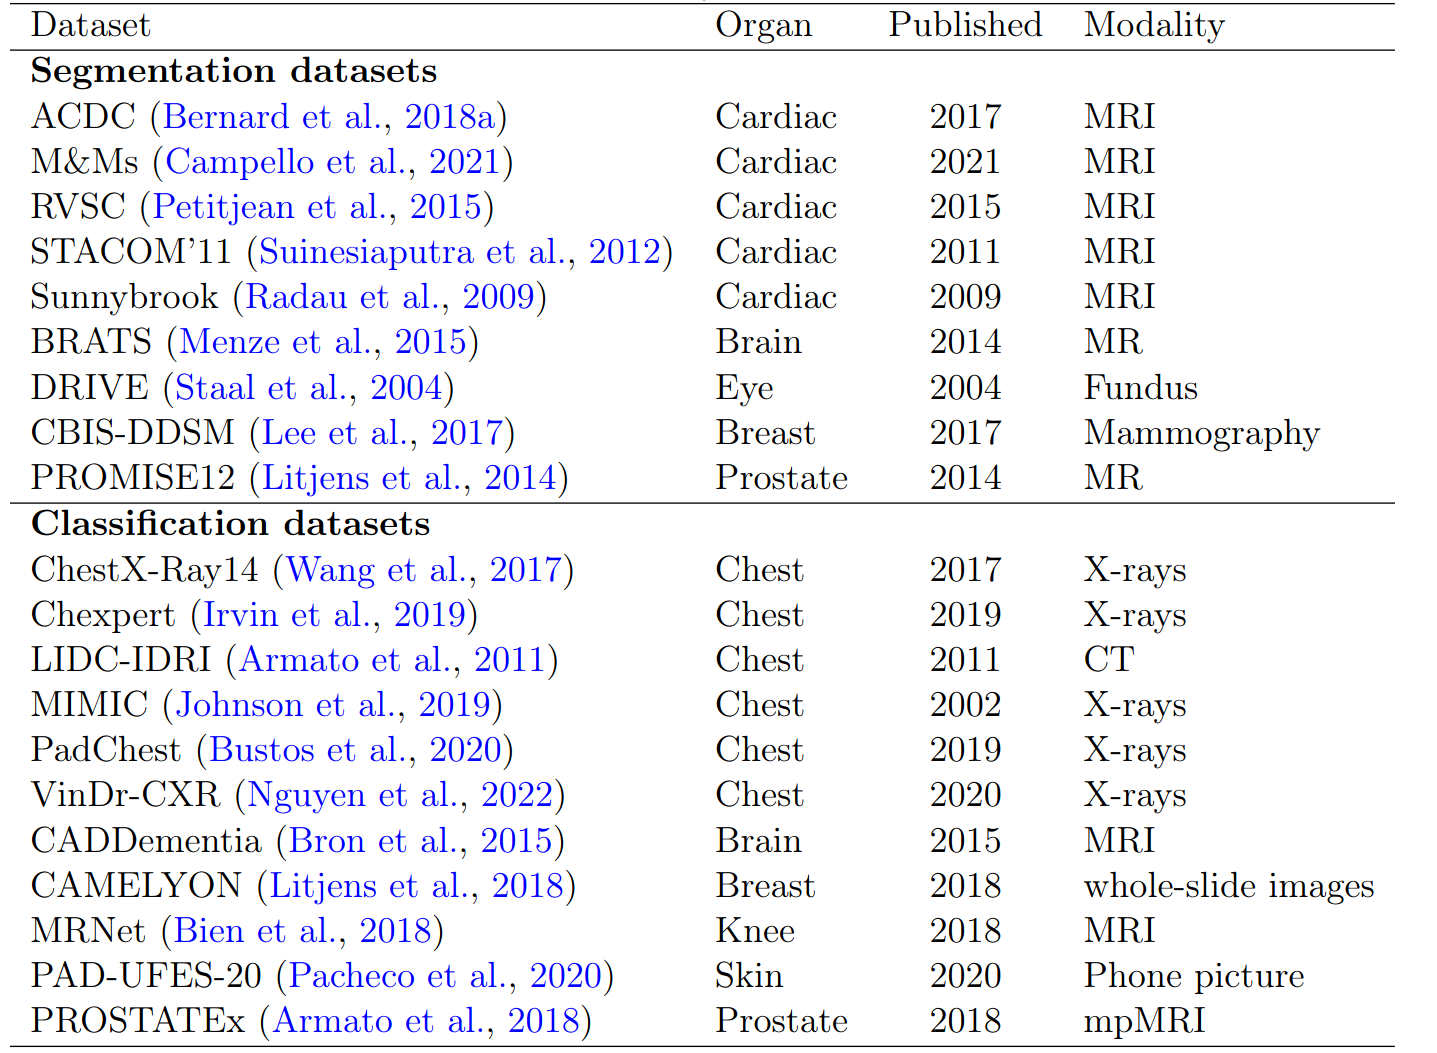
Now let’s compare the different datasets to see if some are more present and used than others. We selected 20 datasets both for segmentation and classification with various organs. We selected multiple datasets for the cardiac segmentation and the chest x-ray classification tasks to evaluate the diversity for a similar task.
We found very similar results for both segmentation and classification as displayed in the figures, they show the cumulative citation in full line and mention in dash line across years:
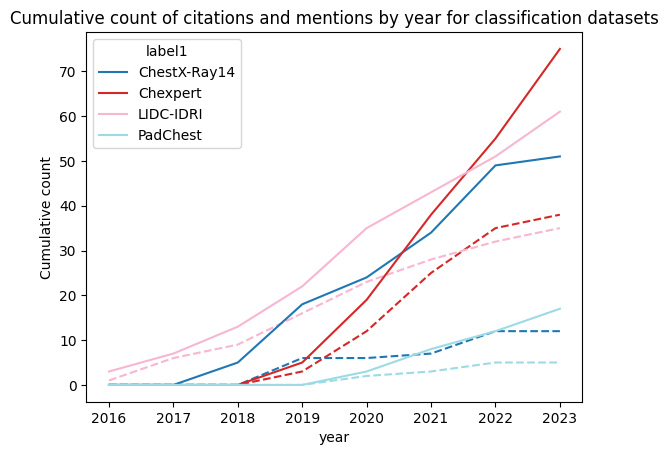
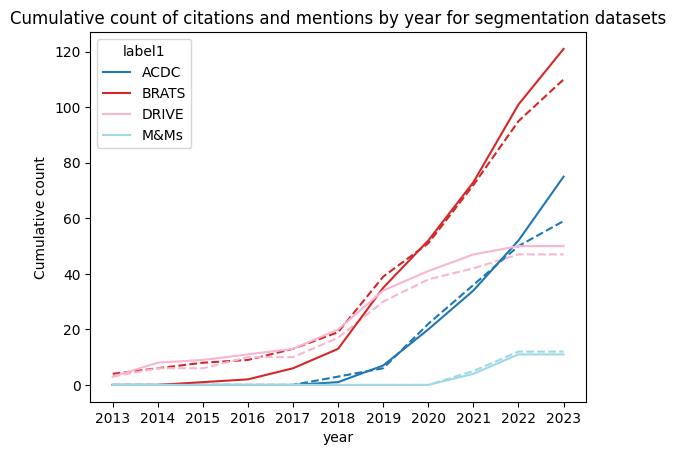
We only selected some datasets to highlight our findings. But our first finding is actually that most of the 20 datasets were almost not cited or mentioned at all showing the concentration of research on a few datasets as we hypothesis at the beginning of our study. Finally, we can also see a lack of diversity for the same task. Focusing on the segmentation datasets, we can obviously see that BRATS is by far the most present dataset but the main point here is that ACDC and M&Ms which are both cardiac segmentation datasets have very different results. ACDC still receives more citations and mentions despite being released before M&Ms while M&Ms already stagnating.
Recommendations
We derived from our study a set of recommendations:
First for dataset providers, releasing a paper associated with the dataset will be very beneficial for the user to have a resource easy to cite to benefit from the classical citation tracking tools. Also, choosing a proper and unique name for your dataset is very important, a “funny” finding from our work is the usage by 3 different datasets of the acronym “ACDC”, 2 from the medical domain.
Then for authors and the community, we should really document the dataset we use and follow the provider’s guidelines. While this may seem obvious, our research showed that is not always done. Finally, we should work toward a standard way to acknowledge dataset usage. We could for example take inspiration from some journals and venues asking for specific a “data availability” section in their guidelines.